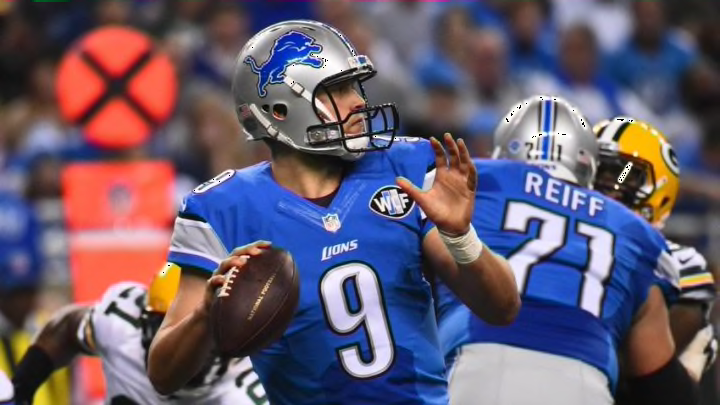
Joe Lombardi vs Jim Bob Cooter
When Martha Ford fired offensive coordinator Joe Lombardi after week seven, Jim Caldwell promoted then quarterback coach Jim Bob Cooter to replace him. In week eight, the Lions traveled to London to face the Kansas City Chiefs. Between travel and organizational distractions, Cooter was limited in the amount of plays he could introduce and for the most part used Lombardi’s offensive playbook. It predictably was not effective.
The following week was the Lions bye and Cooter was able to incorporate more plays and introduced a new philosophy into the Lions offense. The results were promising as Stafford’s already solid numbers improved, and we saw a shift in the skill players production.
When breaking down the numbers, I am not assigning blame for week eight to either Lombardi or Cooter because of the extenuating circumstances surrounding that game. With that being said, lets take a closer look at Stafford’s production under each coordinator.
| Matthew Stafford | Game | Comp | Att | Comp % | Yards | TD | Int | Players Targeted |
| Joe Lombardi | 1 | 19 | 30 | 63.3 | 246 | 2 | 2 | 7 |
| 2 | 32 | 53 | 60.4 | 286 | 2 | 1 | 7 | |
| 3 | 31 | 45 | 68.9 | 282 | 1 | 2 | 7 | |
| 4 | 24 | 35 | 68.6 | 203 | 0 | 0 | 9 | |
| 5 | 20 | 32 | 62.5 | 188 | 1 | 3 | 11 | |
| 6 | 27 | 42 | 64.3 | 405 | 4 | 1 | 7 | |
| 7 | 18 | 26 | 69.2 | 256 | 2 | 0 | 7 | |
| Jim Bob Cooter | 10 | 24 | 38 | 63.2 | 242 | 2 | 1 | 8 |
| 11 | 22 | 35 | 62.9 | 282 | 0 | 0 | 7 | |
| 12 | 27 | 38 | 70.1 | 337 | 5 | 0 | 8 | |
| 13 | 23 | 35 | 65.7 | 220 | 2 | 0 | 7 | |
| 14 | 30 | 46 | 65.2 | 245 | 2 | 1 | 9 | |
| 15 | 22 | 25 | 88 | 254 | 3 | 0 | 9 | |
| 16 | 29 | 37 | 78.4 | 301 | 2 | 0 | 8 | |
| 17 | 28 | 39 | 71.8 | 298 | 3 | 0 | 8 | |
| Joe Lombardi | Average | 24.42 | 37.57 | 65.02% | 266.57 | 1.71 | 1.29 | 7.86 |
| Jim Bob Cooter | Average | 25.63 | 36.63 | 70% | 272.38 | 2.38 | 0.25 | 8 |
So we see that under Jim Bob Cooter, Stafford saw an uptick in his numbers across the board, the biggest variations coming in his completion percentage (up 4.98%), touchdowns (increased .67 more per game) and interceptions (reduced by 1.04 per game).
The same increase in production wasn’t as true for all the skill players, but as you can see from the chart below, there were clear preferences in players who could execute his game plan.
| Joe Lombardi | Receptions | Targets | Comp % | Jim Bob Cooter | Receptions | Targets | Comp % |
| Golden Tate | 40 | 68 | 58.8 | Golden Tate | 50 | 60 | 83.3 |
| Calvin Johnson | 48 | 78 | 61.5 | Calvin Johnson | 40 | 71 | 56.3 |
| Theo Riddick | 42 | 53 | 79.2 | Theo Riddick | 38 | 46 | 82.6 |
| Eric Ebron | 23 | 33 | 69.7 | Eric Ebron | 24 | 37 | 64.9 |
| Lance Moore | 22 | 32 | 68.8 | Lance Moore | 7 | 11 | 63.6 |
| Ameer Abdullah | 13 | 23 | 56.5 | Ameer Abdullah | 12 | 15 | 80 |
| Joique Bell | 7 | 8 | 87.5 | Joique Bell | 15 | 19 | 78.9 |
| TJ Jones | 1 | 3 | 33 | TJ Jones | 9 | 15 | 60 |
| Tim Wright | 8 | 14 | 57.1 | Tim Wright | 1 | 2 | 50 |
| Brandon Pettigrew | 3 | 7 | 42.9 | Brandon Pettigrew | 4 | 8 | 50 |
| Michael Burton | 2 | 2 | 100 | Michael Burton | 4 | 4 | 100 |
| Corey Fuller | 3 | 7 | 42.9 | Corey Fuller | 1 | 2 | 50 |
| Zach Zenner | 2 | 3 | 66.7 | Zach Zenner | Injured | x | x |
Right off the bat, Golden Tate’s production saw a much higher level of success (an increase of 24.5%) with Jim Bob Cooter as the offensive coordinator. Other skill players saw subtle changes, Calvin Johnson’s numbers took a slight drop, as did Eric Ebron’s, while Theo Riddick saw a slight increase in his.
Ameer Abdullah saw his consistency take a big jump while Joique Bell was still a productive receiving running back despite a slight decline. Lance Moore saw his targets cut by 1/3, losing most of them to TJ Jones, and the remaining players were about the same.
Next: Looking forward to life without Calvin
